NZ Corporate Travel Oversight Dashboard: Board Metrics and Escalation Triggers
Travel is often one of the most visible discretionary costs in an organisation, but many boards still see it only as a long appendix in the finance pack. For sectors like healthcare, energy, pharmaceuticals, media, universities, professional services, and government, that is no longer enough. Boards want clear, comparable oversight of spend, risk, emissions, and resilience, not another operational report that gets skimmed and filed.
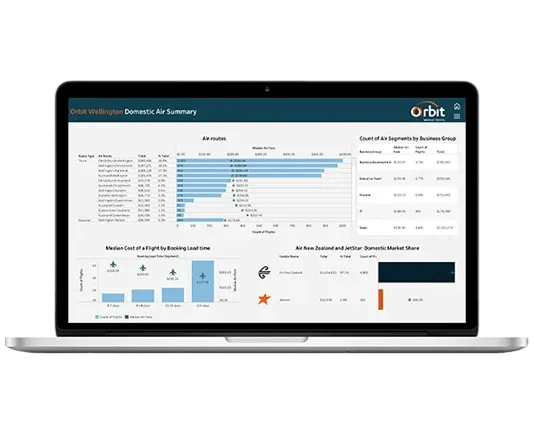
An executive oversight dashboard turns your travel data into a governance tool. It focuses on fewer metrics, clear thresholds, and direct links to policy and risk appetite. Rather than listing every flight and hotel, it answers questions like: are we within budget, inside policy, within our duty of care expectations, and aligned with ESG settings?
Designing a single source of truth for executive travel oversight
A board-ready dashboard should be simple on the surface and rigorous underneath. The aim is one source of truth, not five different versions of “actuals” in different spreadsheets.
Good practice includes:
10 to 15 core measures only, with clear definitions
Direct traceability back to source systems
Consistency across business units, cost centres, and regions
Using Orbit Enterprise and Orbit Intelligence, we bring together data from tools such as Zeno and Amadeus, plus card providers, HR and ERP systems. This allows near real-time visibility of all travel activity, including exceptions and offline bookings, so executives are not relying on partial data or manual reconciliations.
Structure matters too. Most organisations benefit from:
A high-level summary view for the board and executive team
Drill-down dashboards for finance, procurement, and travel managers
Filters by division, project, traveller type, and route category
Governance alignment is just as important as the data. Metrics should map to your existing committees: Audit and Risk, People and Culture, ESG, and, for sectors like healthcare and universities, clinical or research governance. This keeps travel where it belongs, inside your established oversight channels.
Seasonality is another factor. In New Zealand and Australia, many organisations plan travel budgets in the middle part of the year. A strong dashboard supports forecasting for academic semesters, clinical conference periods, and project mobilisation phases in energy and infrastructure, so peaks are visible and planned, not surprises.
Core financial and compliance metrics every board should see
For most boards, the starting point is financial control and policy adherence. The dashboard should give a clear line of sight without overwhelming detail.
Useful financial metrics include:
Total travel spend by period, business unit, project, and traveller type, with trends against budget and prior periods
Average trip cost and cost per traveller day, split by domestic, trans-Tasman, and long-haul
Indicators of savings behaviour, like advance purchase habits, policy-compliant fare choices, and usage of negotiated agreements
Policy compliance deserves its own view. Key measures typically cover:
Compliance rates for booking channels, class of travel, preferred suppliers, booking lead time, hotel rate caps, and vehicle categories
Volume and reason codes for exceptions, such as clinical urgency, remote site needs, senior executive patterns, or media events
Clear identification of AoG (All-of-Government) or sector-specific rules, so boards can see when constraints are policy-driven rather than behaviour-driven
Escalation thresholds turn these numbers into action. For example:
A 10 to 15 percent variance to budget in any division across a defined period
A sustained rise in non-policy bookings or manual interventions
Repeated use of higher fare classes beyond agreed bands
Each threshold should have an agreed pathway: what the travel manager reviews, when finance or procurement steps in, and which situations are reported to the executive team or board.
Making duty of care and disruption risk measurable
Duty of care is no longer a side issue. Boards want to know where their people are, how quickly they can be reached, and how well disruptions are handled, especially in sectors with field staff, clinical teams, or researchers offshore.
A strong corporate travel management platform in NZ should provide:
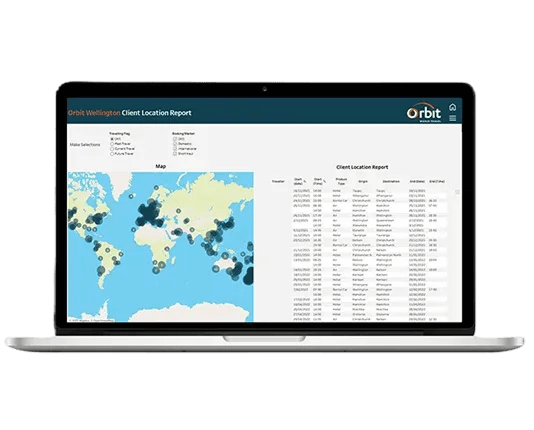
A consolidated view of travellers’ locations, itineraries, and recent movements, accessible at any time
Exposure reporting by country, city, or region, including groups on the ground for projects, conferences, or placements
Traveller contactability metrics, highlighting missing or out-of-date profiles
Orbit Intelligence can support incident views that show who is affected in a specific area and how contact is progressing. From that, you can track duty of care performance:
Time from incident notification to first contact attempt
Time to successful contact and, where needed, to re-accommodation
The share of travellers who have completed required pre-trip briefings or approvals for higher-risk destinations
As with financials, thresholds and escalations are key. Examples include:
Any incident affecting more than a defined number of travellers
Repeated situations where a set percentage of travellers cannot be reached within agreed timeframes
When these thresholds are crossed, you can trigger involvement from risk or health and safety teams and, where warranted, formal reporting to the board. Periodic review of these settings is especially important where you support vulnerable populations or work in higher-risk operational environments.
Embedding sustainability and ESG into travel oversight
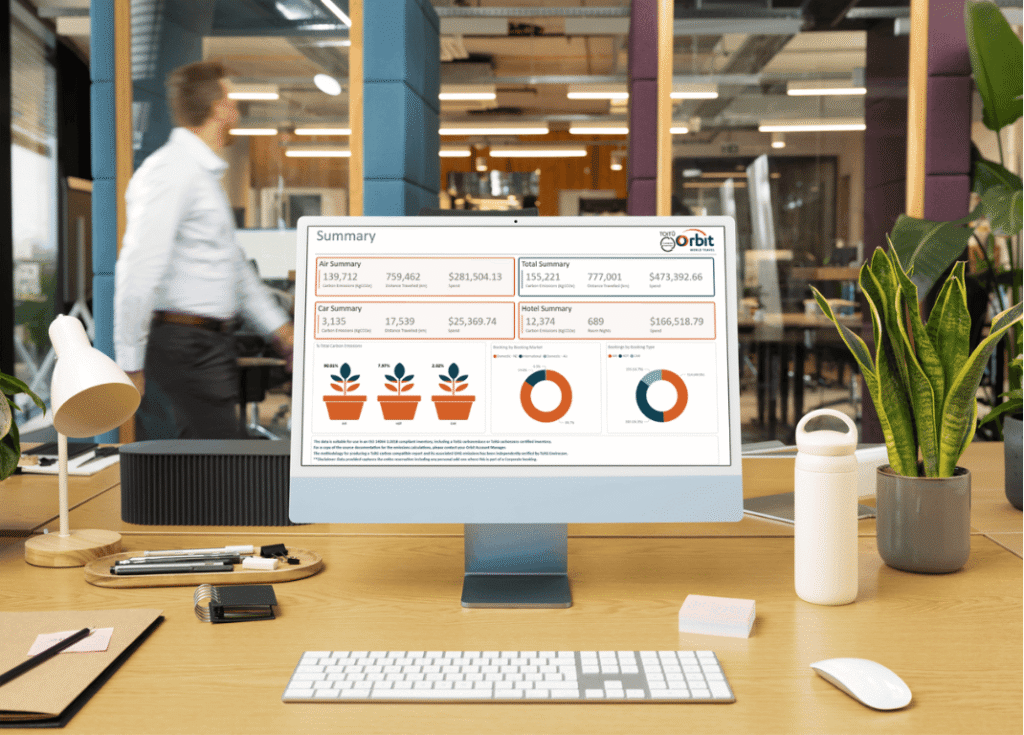
Travel is an obvious contributor to organisational emissions, so ESG reporting increasingly expects clear, consistent data. The executive dashboard should present carbon and cost side by side.
Typical carbon views include:
Total emissions for a period
Emissions per trip, per traveller, and per cost centre
Comparisons by sector activity, such as clinical trials, site visits, field research, or media production
Orbit Intelligence can align emissions with recognised methodologies to support ESG disclosures, without requiring executives to interpret raw calculation rules. Scenario views, such as the impact of shifting part of a programme to virtual or consolidating trips, help leadership evaluate policy options.
Supplier mix is another part of the picture. An independent travel management company can report:
Share of travel with preferred suppliers
Use of lower-carbon options where available, across air, accommodation, and ground transport
Instances where the actual supplier mix drifts from your sustainability objectives
ESG thresholds might include:
Emissions per FTE or per revenue unit exceeding internal expectations
Growth in high-emission travel categories that outpaces organisational growth
Under-use of lower-impact options when they are operationally feasible
These indicators should connect into your wider reporting cycles, such as annual reports and sustainability frameworks, so travel ESG performance is tracked like any other risk or opportunity.
Building your executive travel dashboard roadmap
Most organisations will benefit from a staged approach. A practical roadmap often starts with a discovery phase to catalogue current reports, data sources, and stakeholders. From there, you can identify gaps in visibility, data quality issues, and areas where escalation paths are unclear or informal.
Aligning travel metrics with your risk appetite, delegations of authority, and existing board templates helps make sure the dashboard lands well. Finance, procurement, HR, risk, and key operational leaders should be involved early so the final view serves whole-of-organisation needs, not just one function.
We then see value in piloting. Define your core metrics and thresholds, configure Orbit Enterprise and Orbit Intelligence views, and test them with one or two high-travel divisions or faculties. Because Orbit World Travel New Zealand is a 100% locally owned and operated, with the backing of ALTOUR’s global network, we can adjust for New Zealand and Australian regulatory settings, AoG frameworks, and sector-specific nuances.
Across two or three reporting cycles, executives can refine what they see, how often they see it, and which issues are escalated where. When the dashboard is embedded into monthly executive meetings, quarterly board packs, and annual planning, corporate travel management in NZ shifts from scattered reports to a consistent, board-ready oversight tool that supports spend control, duty of care, and ESG commitments in a single, coherent view.
Streamline your corporate travel with local experts
If you are ready to simplify bookings, control spend and keep your travellers supported wherever they are, we are here to help. Explore how our corporate travel management in NZ can be tailored to your organisation’s policies and priorities. The team at Orbit World Travel New Zealand will work with you to design a smarter, more reliable travel program that fits your budget and risk profile. To discuss your requirements or request a proposal, simply contact us.